Last season, Penn State ended the year with a +4 turnover margin, putting them roughly in the middle of the Big Ten. Through seven games this season, the Nittany Lions are trending toward the bottom of the conference with a -3 turnover margin. But it has always been my belief that the turnover margin only tells half of the story.
What does the offense do once they gain a possession from a turnover? What does the defense do when sent back on the field following a turnover. I think what happens after the turnover is just as important, if not more important than the actual turnover.
I did a brief search to see if any such data exists, and I did not find anything. If this data or something similar does exist, please feel free to let me know. With nothing to review, I decided to open up Excel and start plugging in my own primitive data, which I am referring to as turnover efficiency. It is basically a way of tracking the point differential off a turnover, and a way to see if there are any trends with the offense or defense following a turnover.
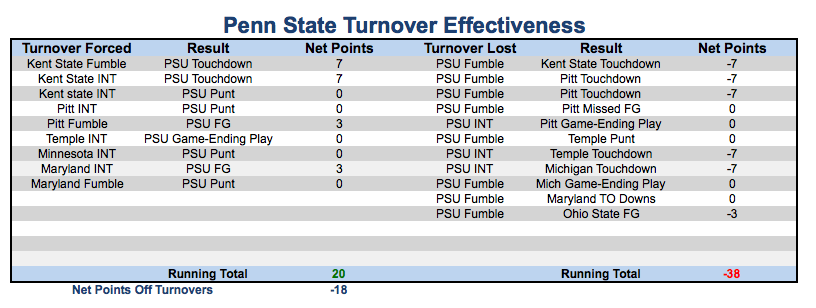
In the chart below, you can see the left column tracks all turnovers forced by the defense (or perhaps special teams). The next column tracks what Penn State’s offense did following the turnover, followed by the net points gained off a turnover. On the right half of the chart, I track all turnovers lost by Penn State’s offense, what the opponent ended up doing with the turnover and the net points lost to the opponent. In brief, the more data and points scored on the left half, the better.
Here is what we have so far this season, through Penn State’s wild upset of Ohio State on Saturday night, and a few observations and further explanations can be found below:

A few quick points about this chart…
- A few of these turnovers resulted in what I defined as “game-ending plays.” That could mean it was the final play of a game or merely led to the opponent being able to take a knee or two to run out the final seconds on the clock. These are not situations that would ultimately lead to points off a turnover, but they will be recorded as such.
- Though not defined, some results will include defensive touchdowns. For example, a Kent State interception was returned for a touchdown by Penn State. This still qualifies for this chart because points were scored off the turnover. So not all points have to be scored by the offense.
- I do not track turnover on downs, but will consider it in the future.
- Special teams points are not included, even if off a blocked field goal try.
Penn State has scored one offensive touchdown off a turnover this year
One thing the Penn State offense can improve is pretty clear. The Nittany Lions have struggled to fully punish opponents for turnovers this season. Of the nine turnovers forced this season, just once resulted in a Penn State touchdown on offense. The only other touchdown scored off a turnover this season came on an interception returned for a score by the defense. The last offensive touchdown off a turnover was in the season opener against Kent State. Since then, Penn State has managed just two field goals off six straight turnovers (not including one that resulted in the end of a game against Temple).
Penn State has managed to score 20 points off nine turnovers this season. Four turnovers have been followed up by a punt.
Getting better at stopping the bleeding?
Since the Big Ten opener against Michigan, Penn State’s offense has done a better job protecting the football. As a result, the defense has not been put to the test of having to come up with a big stop to limit the damage. the lone turnover for Penn State on Saturday night against Ohio State came on a muffed punt, which led to the Buckeyes scoring just a field goal. All in all, that’s not bad.
As you can see, things did not necessarily get off to a great start this season. The first three turnovers of the season by Penn State directly led to touchdowns for the opponent. Until Ohio State’s second quarter field goal Saturday night following a muffed punt by Penn State, Penn State had given up 35 points off eight turnovers, not including two turnovers that led to the opponent simply managing to run out the clock on a game (game-ending turnovers; Pittsburgh and Michigan). That number feels too high for any good team. But Penn State played its best game on defense on the season Saturday night and holding the Buckeyes to a field goal off a special teams error was a decided victory for the defense.
Penn State has room to improve
As Penn State suddenly has a renewed confidence as they prepare for the final stretch of the regular season, it should look to start swaying some of these numbers in their favor. At this point in the season, Penn State has a negative turnover margin (-3), which in turn has been coupled with a negative points-off-turnover margin (-18), which averages out to a -6.0 points per turnover ratio. I have not done nearly enough research and calculating to figure out how that compares to other teams around the Big Ten or the country, but it doesn’t take a mathematician to suggest anything with a negative number here is, well, a negative.
So what happens next? Where does Penn Stater go from here?
Penn State’s final opponents this season have a combined turnover margin of -13, and only one team (Iowa) is on the plus side so far this season (Hawkeyes are a +7). It would seem, if these trends continue, that Penn State will be given some opportunities to start tacking on some points off turnovers. Against some of the opponents remaining, that should be expected, starting this weekend at Purdue.
Follow Nittany Lions Den on Twitter and Instagram!
Like Nittany Lions Den on Facebook!
Add The Sports Daily to your Google News Feed!


