Colin Moran came over in the Gerrit Cole trade as a swing changer who developed tapped into his power in Triple-A a year ago. However, that power hasn’t translated over to the big leagues so far.
Perhaps Colin Moran had too high of expectations entering the year, especially as being the centerpiece in the trade that sent Cole to Houston. Moran had an excellent season in Triple-A in 2017, hitting .308/.373/.543 and tapping into the power that his size (6’4″ and 204 pounds) one would expect.
The numbers are a bit inflated because of the PCL, but the year prior in the same league Moran hit .259/.329/.368 in 117 games. The thing that appeared to be interesting is that he changed his swing, allowing him to get a but more under the ball and use his strength to drive the ball out of the park.
That hasn’t translated this year at the Major League level; Moran is slugging just .391. This is where expectations and reality come in. But the mathematical projections didn’t match the expectations that were potentially set up for Moran, focusing and putting too much emphasis on his 2017 performance. Here’s PECOTA’s projections for Moran, among his current numbers and other numbers:
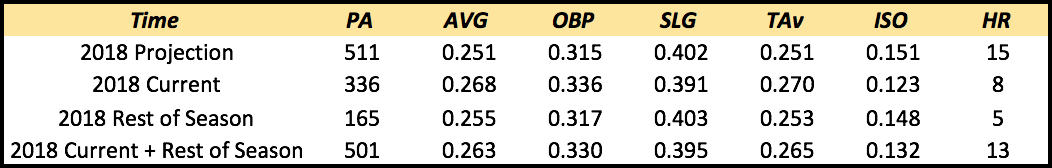
PECOTA projected Moran to be below average as a hitter this season; his .251 TAv (true average) is below the average .260 (every year TAv is scaled to .260). His power wasn’t projected to be all that much, just a .402 slugging and 15 home runs. STEAMER, another projection system had Moran at .259/.318/.398 and ZiPS had Moran at .259/.312/.402. None of the big three projected Moran to be anything besides a below average bat.
So far this season, Moran has been a bit better than average by TAv (primarily because of the strikeout rate of 17.6 percent and lack of double plays compared to the league average player). If you want to call him average to a bit below, .316 wOBA and 99 OPS+, have him as just that, it’s a valid argument.
But the big thing to take away here is that PECOTA, and the other three projection systems, don’t take just one year and go forward, all his past data is relevant, and the swing change was only one year, coming with only one year in which he had power.
Moran projects to finish the season slightly above league average in TAv, but a big chunk of that is the on-base ability that Moran has shown this year, as he’s projected to finish the year with a sub .400 slugging.
***
That’s the difference between fan expectations and hope the swing change is real and a more mathematical look at what is to be expected from Moran; and for reference his 70º percentile PECOTA projection was just .266/.332/.429 with a .263 TAv, an average hitter.
This leads to performance and power, or lack thereof in the case of Moran this season. The chart above has Moran’s current stats (.268/.336/.391), but that doesn’t do any good without context. The National League non pitcher numbers are .255/.329/.417, so Moran is doing a better job of getting on-base but the power is 26 points below the league. For a player whose value is tied to the bat, and at third base nonetheless, more power needs to be shown.
Part of Moran’s problem is hitting more groundballs than flyballs, something he didn’t do when he was showing power in Triple-A last season:
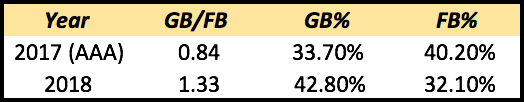
For every flyball the Pirates third baseman has hit, he has hit 1.33 groundballs, and 42.80 percent of his batted balls are hit on the ground. For a 6’4″ third baseman who should have power, this isn’t exciting.
Looking at the Statcast data to get a peek behind some of the numbers behind the scene, ie how hard Moran is hitting the ball and the angle of direction off the bat, the results for the player and the league are as followed:
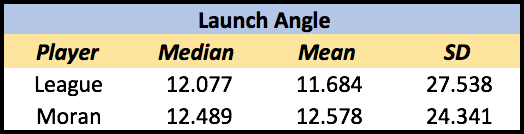
Moran is hitting the ball at a higher degree than the league, having both a higher median launch angle and mean launch angle. The other thing that sticks out is that Moran is more consistent, the standard deviation of Moran’s batted balls are 24.341º compared to the league’s of 27.538º. More consistently isn’t necessarily good or bad – being consistently around an optimal launch angle for your profile is good, being consistently around an unoptimal launch angle for your profile is bad (like if Aaron Judge had a smaller standard deviation with a mean of say 5.0º) – but Moran has less dispersion in the angle of his batted balls than the rest of the league.
More important than launch angle is how hard Moran hits the ball, here’s the league and Moran’s exit velocity:
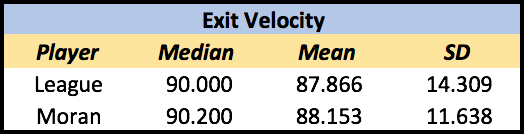
Moran hits the ball harder than the league mean and more consistently (standard deviation of 11.638 compared to 14.309), but the difference in the average is just 0.287 miles per hour, which isn’t significant. The median exit velocities are essentially equal as well.
So Moran is hitting the ball as hard as the rest of the league but more consistently, and he is doing so at a higher launch angle (0.894º), which again he is doing so more consistently. So why does the power lack behind and is 26 points below the National League non pitcher average?
Part of the problem might be Moran not pulling the ball enough. Here is the batted ball location of Moran’s time in Triple-A last season and Pittsburgh this year:
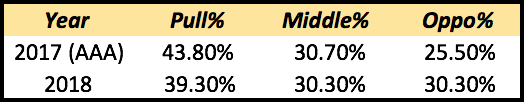
Last year Moran pulled the ball around 44 percent of the time, but this year is pulling it 39 percent of the time. Up the middle is the same, so he’s going more towards the opposite field than pull side, despite it being more advantageous to pull the ball to right at PNC Park.
Comparing Moran to the league shows these numbers:
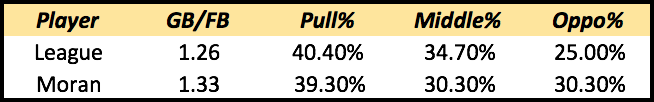
Moran is hitting more groundballs per his flyballs compared to the league, and despite pulling the ball at a similar rate as the league, Moran is using the middle of the field less and is hitting the ball more towards the opposite field. Power will play more pull side than any other area on the field.
But that’s all of Moran and the league’s batted ball types, breaking it down by groundball and flyball have the following numbers:
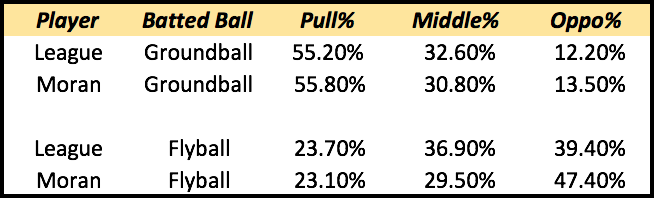
While Moran’s groundball profile is similar to that of the league, it’s the flyball profile that sticks out. Moran is pulling flyballs at the same rate as the league, but his flyballs to center are 7.4 percentage points less than the league and 46.50 percent of his flyballs go to right field.
Nate Werner showed that PNC Park is friendly to left-handed power hitters, and Moran is not taking advantage of that fact. In 2017, PNC Park’s home run factor for right handed hitters was 89, or 11 percent harder for a right-hander to hit a home run at PNC compared to a neutral park. Moran is hitting his flyballs to left field, where it jettisons out to 410 feet in the notch.
To tap into the power that Moran showed, he needs to start hitting the ball more mid to pull side; he’s got the consistency with how hard he hits the ball and how he elevates the ball to utilize the Clemente Wall for doubles and home runs. Instead he’s going the other way all while hitting more groundballs per flyball than the non pitcher average.
***
Expectations are funny. Moran hasn’t lived up to the expectations of being the centerpiece of the Gerrit Cole trade, and he hasn’t lived up the expectations fans have had, especially with the swing change and power he produced last year. However, he is exceeding the weighted mean preseason PECOTA projections.
The one big issue is that Moran’s value is tied to his bat, as his fielding leaves lots to be desired, and his range moving left to right is minimal. His speed is also nonexistent, so for Moran to be an average starter his bat is going to need to be exceedingly above average.
For now, his on-base ability is above average and he doesn’t strikeout much, just 17.6 percent of the time. The power, however, has not played and he has a sub .400 slugging and a .124 isolated power. Despite being around the average exit velocity, about a degree higher in the angle off the bat, and the less dispersion, Moran has hit more groundballs per flyballs than the league.
When Moran does elevate, it’s usually to the opposite field, not fully taking advantage of the wall in right. For Moran to improve his offensive production and profile, and to start tapping into his power, he’ll need to start pulling flyballs more than he is now. He’s still a useful player, 1.1 WARP, but he’s far from a middle of the order bat, and when your value is tied to being one, a new approach in terms of pulling might be in order.
*Numbers from Baseball Prospectus, Fangraphs, and Baseball Savant
*Note that batted ball data from Fangraphs relies on stringer data and there are and can be inconsistencies and inaccuracies in such data; especially when separating line drives and flyballs*
Add The Sports Daily to your Google News Feed!