
The Leftorium
Nothing in this world is certain except death, taxes, and the Oilers needing another right handed defenceman. As we enter the 18/19 season, we once again find a hole on that right hand side. While recent years have seen an uptick in the acquisition of righty prospects for the Oilers, the Leftorium remains a real thing at the NHL level.
The Oilers can have a lefty-righty split on the defence core but it means promoting either Bouchard or Bear to the big leagues, possibly before they’re ready and certainly earlier than the original plan. This means that its likely that they will be forced to play someone on their off-side to complement Adam Larsson and Matt Benning.
The Lefty/Righty split has mattered a lot to coaches, especially in the modern NHL. This was hammered home in an article by Dominic Galamini. He determined that having two same-handed defence partners had a pretty huge impact, causing a decrease in over 6 shot attempts over 60 minutes of play.
This led to the next obvious question to me. Why does it matter? What do defencemen do so much more poorly on their off side that leads to such a decrease in performance?
Among a number of possibilities, the first thing that came to my mind was zone exits.
Handedness and Zone Exits
We know that exiting the zone with control has a tremendous impact on play. I always go back to Jen Lute Costella’s wonderful primer from a few years back. She notes that getting the puck out of the zone with possession (carrying or passing it out) leads to your team going on the offensive 88% of the time. Dumping the puck out leads to the other team going right back on the attack ~70% of time.
This would imply that exiting the zone with possession of the puck should lead to more shot attempts for over the course of the game. If that’s more difficult on your off-side, this should impact your shot attempts. We can test the hypothesis about whether zone exits are worse for defencemen on their off-side. We just need the data.
The Data
Corey Sznajder has been manually tracking NHL games for the last number of years. He includes a whole host of information, all of which he releases publicly at various times of the year. (As a side note, please consider supporting Corey’s project through his Patreon.)
Among the immense number of different microstats Corey tracks for each NHL game are zone exits.
Each zone exit is timestamped, labeled by defenceman, coded as to type of exit and even has the side of the ice the exit originated from. As of the time I did this study, Corey had tracked 548 NHL games from the 17/18 season, totaling details of over 103,000 zone exit attempts! (Yes, you read that correctly! Support his Patreon!)
With this data, we can test just if and how much of an impact it has on a defenceman to play on his off side.
Assumptions
Before we get deep in to this, we should acknowledge an assumption I’m making: playing left defence means you attempt to exit the zone most often from the left and vice versa from the right. This seems fairly obvious, but since we have the data, we should check and confirm.
Luckily, it IS true.
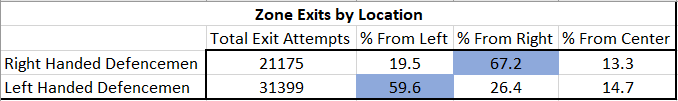
Right handed D-men exit the zone from the right about 2/3 of the time. About 1/5 of the time they exit from the left and the rest from the center. Left handed defencemen exit from their same-handed side slightly less often than righties. There’s more LHDs in the National Hockey League, so it makes sense that lefties play right more often than vice versa.
Does the Left Hand Know What the Right Is Doing?
Before we can determine if defencemen play better on their off-side, we need to be clear on some basic terminology. Corey only tracks when the defenceman is in the defensive zone and is attempting to exit with the puck. If the puck gets out of the zone and isn’t an icing, it’s an “Exit”. If the puck gets out and the team maintains possession of the puck (either through a pass or a carry), it’s a “Possession Exit”. If the puck doesn’t get out (including turnovers), it’s a “Failed Exit”. Finally, “Icings” are self explanatory.
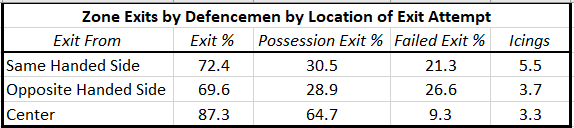
The first thing that pops out is just how much more effective it is to exit from the center lane as opposed to either side. This makes some logical sense. Firstly, if you’re exiting from the center, you’re likely in a different situation than if you’re along the boards. Often, you’ve had some time to skate the puck to the center instead of facing the corner with a forechecker at your back and having more time pressure. If you are under pressure, there’s more directions you can skate or pass it to relieve it instead of forcing a play. You have more potential outlets and you can pass from your forehand to any of them. Still, the degree of benefit is striking.
Acknowledging that, we can look at the table again and ignore the center lane.
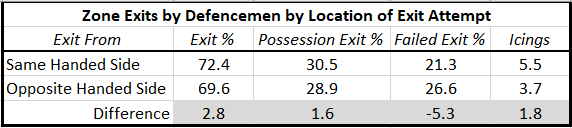
The data shows that playing on your off-side makes it harder to get the puck out of the zone in any way. Possession exits, uncontrolled exits and even icings decrease. Failed exits increase by a whopping five percentage points! These include defensive zone turnovers, which are often deadly.
Given the massive number of zone exits we’re talking about here, these differences do appear to be significant, with p values well under 0.01 for each category.
Its safe to assume that playing defence on your off-side leads to a statistically significant drop in your ability to get the puck out of the zone, including with possession, and makes it more likely you’ll have a “failed” zone exit.
So What?
We now know that exits drop when a defenceman tries to exit from his off side. We don’t yet know how much it matters.
If a defenceman drops his exit percentage from 72.4% to 69.6%? Does that 2.8% really matter? What’s the difference between a 72.4% defenceman and a 69.6% defenceman?
It turns out that it the answer is “a lot”.
Corey has tracked over 100 zone exit attempts for 192 defencemen last season. If we took the top 6 defencemen from every team, we’d have 186 players, so Corey’s 192 is a practical sample to use and helps weed out the players with extremely low sample sizes.
The table below is just left and right exits (removing center exits) and ranks the 192 defencemen results into percentiles so we can give the difference in our table above some context.
![]()
It turns out that the 2.8% drop that we found really does matter.
The difference between an Exit% of 72.4 and 69.6 is the difference between the 55th percentile and the 27th percentile.
That’s like going from 88th in the league (a #3 defender) to 143rd (a #5 defender). Dropping a whole pairing because you’re playing your off side seems significant!
The difference in Possession Exit% is less significant. Going from 30.6% to 28.9% is like dropping from the 55th percentile to the 44th. That’s the equivalent of dropping from 88th in the league to 109th (or from a #3 to a #4, all else being equal). That matters, but it’s not quite as glaring as the overall drop.
The Failed Exits are where the real problem is.
Switching sides is the equivalent of dropping from the 62nd percentile to the 21st. On your strong side, you’re the 74th best defender (a solid #3) and on your weak side you’re down at 154 (bordering between a #5 and #6).
It’s important to note that the icings drop playing on your off-side too. In discussions about this, Bruce McCurdy of The Cult of Hockey quickly pointed out to me that it’s a lot harder to ice the puck on your backhand, which likely explains the significant drop in icings.
The problem is that those icings are being converted to failed exits. At least with an icing, you can reset and have a near 50% chance of winning the faceoff to attempt a more structured breakout.
Ban All Lefties On The Right?
What about all those left-handed defencemen that play on the right? There’s fewer of them these days, but they still exist given there’s far more lefties than righties in the NHL. Do they get better with practice on the right?
I wanted to see if LHDs who played a fair bit of time on the right did better than other LHDs. So I looked at all of this again, but limited the data to LHDs that had at least 100 recorded zone exit attempts (118 players) and then picked the ones who exited at least 40% of the time on the right in order to try to find the LHD who play mostly on the right.
That left me with 21 LHDs who presumably had at least some experience on the right hand side in Corey’s sample this last season.
Among those left handed defencemen, that being the 21 in Corey’s sample who had at least 40% of their zone exits from the right and therefore likely played a fair portion on their off-side, the penalty for exiting from their off-side disappeared.
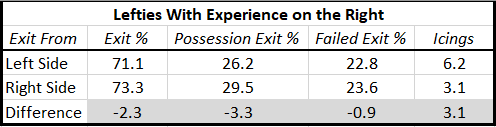
They had more exits with possession from the right, fewer icings, and very similar failed zone exits.
Now, I’d caution from reading TOO much in to this finding, but it is interesting and suggests that some lefties can play the right.
The reasons to be cautious with this finding is that the sample size drops considerably in this subsection of the data (only 21 defencemen made the cut off) and more importantly, this is an entirely arbitrary set of cut offs.
How meaningful is the 40% cut off? I don’t know. I made it up as a random cut point. It would be better to look at the data continuously to see if those who spend more time on their off-side exit better on that side. So I did that in the graph below.
For the purposes of this graph, I’m ignoring exits from the center and limiting to defencemen with at least 100 exits. The x-axis is the percentage of exits that defencemen made on their same-handed (“strong”) side. The farther you go to the right of the graph, the more exits you’re doing from your same-handed side.
The y-axis is the difference in percentages for zone exits between the strong side and the weak side. The closer to the top of the graph, the better you do on your same-handed side.
The result is that the bottom left of the graph is defencemen who exit on their off-side a lot and do it better than their same-handed side. The top right is defencemen who mostly exit on their same-handed side and do so much better than on their off-side.
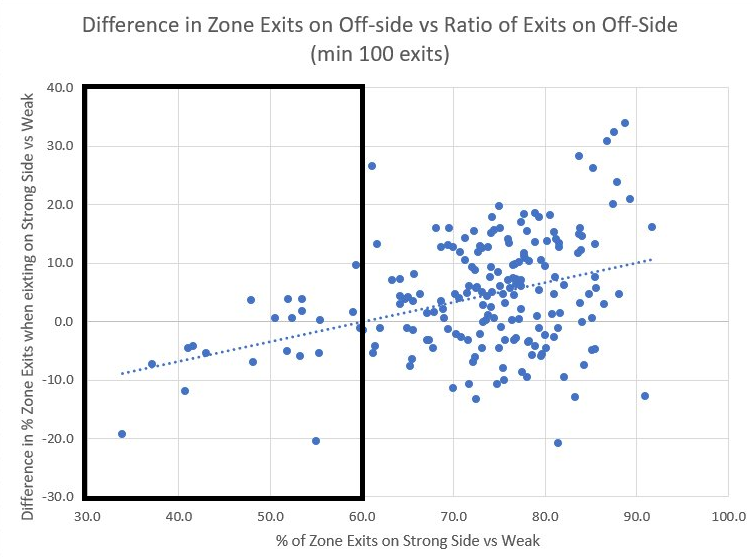
You’ll note that the data points are closer together on the left than the right. That’s because at the far right of the graph, the sample size can get pretty small for exits on the off-side. Even at a minimum of 100 exits, if 90% are on your same-handed side, we’re talking only around 10 on your off-side. That leads to a lot of noise on that side of the graph.
None the less, what we see is a correlation but a weak one between relative exits on the off-side and how well you do there. The R2 of this trend line is 0.14. Not a strong correlation but it’s something.
The 60% mark on the x-axis is the cut off point I arbitrarily picked earlier. Everyone to the left of that (in the black box) is the 21 defencemen isolated earlier. Those individuals (but one) are all either below the “0” mark on the y-axis or within about 5 percentage points of it, meaning they’re either better exiting on their off-side or somewhat close to even. To the right of that 60% line, it’s a complete mess.
It does seem like there’s a few left-handed defencemen who exit reasonably well on their off-side and play there a lot. Either they’re able to do that because they spend a lot of time there and have “figured it out” or the coach put them on that side because they’re good on their off-side.
That’s an important distinction with practical implications. In a league with more LHDs than RHDs, yet a competitive advantage to balancing handedness, if you can find the LHDs that play as well on the off-side you can offset the difficulty of finding RHDs. If more time on your off-side helps you exit better from there, you should target LHDs who spend a lot of time on the right. If some defencemen just happen to be better on their off-side, you could focus your search to target defencemen who do well on their off-side even in short to medium samples and take a chance on them.
About Those Oilers?
This data has some implications for the Oilers’ plans this coming season.
If this team is going to speed up its transitions from the defensive zone out, it’s going to be more difficult to do so by playing a defenceman on his off side. Unfortunately, the only way to do that is by playing either Bouchard or Bear. This data would be a point in favour of pushing them if they’re possibly ready.
If Bouchard and Bear aren’t ready (or the Oilers don’t want to push them), they will need to play a left-handed defenceman on his off-side. In that case, they may benefit from looking at which defencemen actually exited decently on their off-side. This will be the topic of my next article. Spoiler alert: Kris Russell wasn’t an ideal answer.
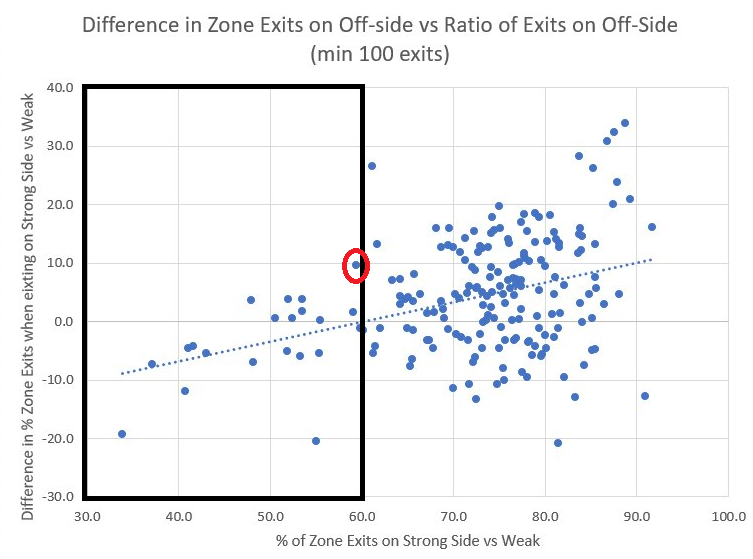
See that red circle? In the black box of LHDs with at least 40% of exits on their off-side, that data point represents the player that did the worst relative to his left side. That’s Kris Russell. His zone exit percentage is 10 percentage points less on his right side than his left side. Whatever else you think of Kris Russell, the Oilers playing him on his off-side is hamstringing him more than a lot of other defencemen.
Anything Else?
Zone exits are a key action in how defencemen generate offence. There’s a lot more to playing defence than zone exits, but its important to note how zone exits effect the performance of the entire team. If you don’t have the puck, you can’t score.
It’s interesting to me that there’s this group of defencemen that play a lot on their off-side and do okay (Kris Russell aside). Going all the way back to that wonderful article by Dom, mentioned at the beginning of this post, I wonder if the difference in shot attempts from playing two same-handed defencemen is driven by having so many defencemen who don’t spend a lot of time there.
Is that ameliorated by looking at same-handed defensive pairs where one defenceman spends a lot of time on the off-side? I can’t answer that yet but it might be something worth looking a bit closer at if the findings I noticed here are more broadly true.
We also need to know if playing well on your off-side is a repeatable skill or if it is random and doesn’t carry over from year to year. Corey does have more data in previous seasons and in this coming season that may allow us to test that question as well.
Further, there’s almost certainly more than just zone exits that are impacted playing the off-side. I plan to explore that in the future as well.
Before that, though, I’ll take a closer look at the Oilers defence and how they exited the zone last season, including how handedness played a role.
Lastly, I need to give one more shout out to Corey Sznajder. His countless hours gave me this data. I know first hand how much time it takes to track even a fraction of what he does. We all benefit from his release of this data publicly. If you’re not contributing to his Patreon, consider doing so!
Add The Sports Daily to your Google News Feed!