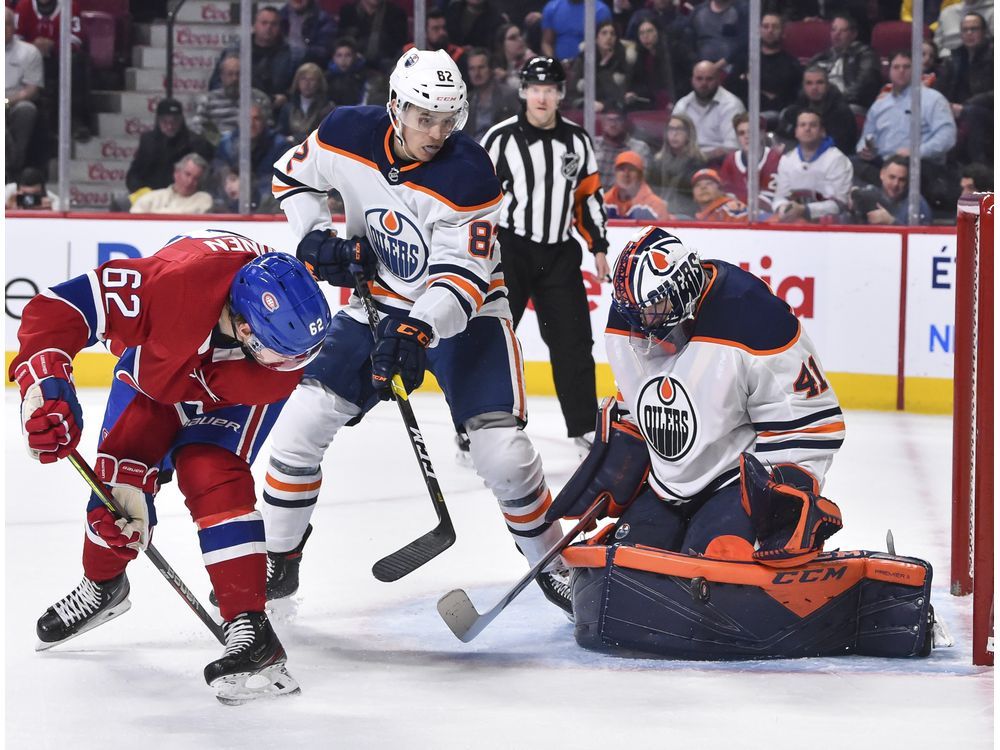
On July 17th, the Edmonton Oilers – and the other NHL teams, for that matter – will submit their protected lists for the Seattle Expansion Draft. There has been much debate about what protection scheme the Oilers should use, and who should be slotted within that protection scheme. Perhaps the subject of most of the fanbase’s discontent is the possible exposure of Caleb Jones, who found himself on the outside looking in for the Oilers this past season. Seemingly, the coaching staff’s concern was Jones’s ability to keep the puck out of his own net. Indeed, Jones’s 5v5 on-ice goal numbers were poor (11 for, 18 against, for a GF% of 37.9%). Yikes. However, there are some who think Jones’s numbers are a product of poor goaltending when he was on the ice, and on its surface, this theory seems sound. Edmonton goalies posted only a .899 save percentage at 5v5 with Jones on the ice. But it’s an open question whether this stat is (1) beyond Jones’s control, and (2) responsible for his poor goal numbers. I’ll try to answer those questions with some data because it’s what I do. I’ll answer the first in Part 1 and I’ll try to answer the second in Part 2. In all the below analyses, I use regular season 5v5 data and include all defencemen who played at least 400 minutes in both seasons (so, alas, you won’t see Oscar Klefbom). I got these data from Natural Stat Trick.
First, one of the axioms about On-Ice Save Percentage (OISV%) and On-Ice Shooting Percentage (OISH%) is that they generally regress toward league average. In other words, a player who has put up a high OISH% can expect their on-ice goal numbers to taper off, and likewise, a player who has benefitted from a high OISV% can expect their +/- to decrease (see: Leon Draisaitl). If this is true, there should be no strong relationship between a player’s OISV% year-over-year; a player who has low OISV% one year should be no more likely to have low OISV% the next than any other player.
As you can see in the above graph, this is true. Note that the label for each Oiler is aligned to the right of the point that represents them. The correlation between 2020 OISV% and 2021 OISV% among defencemen is approximately zero (it’s r = -.009). It is impossible to predict a defenceman’s OISV% from their previous year’s OISV%. So, by that metric, you’d expect players to regress toward the mean (and you’d take the blame for a low OISV% off of the player). As you can see, of Oilers defencemen, Jones has the worst 2021 OISV%, and is in the bottom 12 of the entire league.
But, as I’ve argued both on Twitter and in person, certain types of players (i.e., those that are poor defensively) are going to be more likely to give up higher quality scoring chances, and from that you’d expect a lower OISV%. Importantly, you wouldn’t necessarily expect that from players who are on the ice for the most expected goals against, nor from the players who give up the greatest number of high-danger chances. Why? Because OISV% is by definition a ratio. A player who gives up a large number of high-danger scoring chances might also give up a proportionately large number of low-danger chances, leaving the percentage of those chances that go in the net unchanged. This would, however, lead to a higher expected goals against, as that stat is cumulative. The measure that one might expect to impact OISV% might be something like ‘percentage of chances against that are high danger chances.’ In that instance, you might expect a defenceman who gives up more high danger chances, but not more total chances, to have a low OISV%. And you’d generally be right if your assessment was that a defenceman of that description isn’t very good. So, let’s start there.
I calculated a variable that is High-Danger Chances/Total Chances; let’s call it average Chance Quality Against. Another way you could reasonably do this is Expected Goals Against/Total Shots Against, or expected goals per shot, but I’ve arbitrarily chosen the former. There are a few questions we can answer with this variable, the first of which is a test of concept: ‘do defencemen who have high Chance Quality Against have low OISV%?’ Or, is there a negative correlation between these two variables?
For 2020:
For 2021:
A few things to point out:
- Yes, defencemen who give up a greater proportion of high danger chances have a lower OISV%.
- In each of the last two seasons, Caleb Jones has the highest Chance Quality Against of any regular Oiler not named Tyson Barrie.
- The correlation is quite a bit smaller this year than last year. I assume this is at least in part due to the smaller sample size because of the shortened season. Visually, it would seem that the points are slightly more spread around this year.
- There seems to be a pattern as to which Oilers are above and below the line of best fit here. Keep these last two points in mind, as I’ll try to address them in Part 2.
So, yes, there seems to be something to my notion that OISV% is not fully separable from player performance. In fact, you could argue that a correlation of ~ -.3 is actually an indicator that defenceman performance has a reasonably strong influence on OISV% when you factor in that we are predicting save percentage without any information about the quality of the goaltender. That is, we can predict about 8.5% (our 2020 correlation, .3, squared) of the variance in save percentage based only on one of the two defencemen on the ice and without any variable corresponding to goaltending. You could reasonably spin this either way, and I’ll get to the question of what happens when you factor in goalie performance (stay tuned for part 2 next week), but first, let’s establish how consistent a measure Chance Quality Against is. Even though OISV% doesn’t correlate year-to-year, does Chance Quality Against?
Yes, it pretty clearly does, and this makes sense. It stands to reason that defencemen who leak high quality chances do so consistently. That is, some defencemen are better defensively than others. This is not a ground-breaking discovery. But, given Chance Quality Against is a predictor of OISV%, and Chance Quality Against is at least relatively stable year-by-year, one can reasonably infer that those who suffer low OISV% have done so at least partially because of their own performance. In other words, it may be the case that Caleb Jones’s goal numbers are deflated by a low OISV%, but it is also true that he’s on the ice for a greater proportion of high quality scoring chances against, and as we saw, this is associated with a lower OISV% NHL-wide. So Jones’s low OISV% is probably at least partially due to his own defensive performance.
_____________________________________________________________
That’s it for Part 1; I’ll follow up with Part 2 next Sunday at noon Eastern, and there I will include a measure of goaltending to explore whether (1) Chance Quality Against predicts OISV% over and above goaltending quality, and (2) how well that combined model predicts OISV%. Then I’ll take a stab at what on-ice goal numbers we should have expected this year from Caleb Jones based on his defensive performance and the performance of his goalies. Part 2 will be more stats-y than this one (which is why I split it here), so I apologize for that. But I think it’s cool.
You can find me on Twitter @OilersRational. If you have any criticisms or questions, I’d love to hear and/or answer them. Also, if you have any interesting questions that might be answerable with data, shoot them my way and I can take a crack at them.
Happy Father’s Day.
Add The Sports Daily to your Google News Feed!


