Tampa Bay Rays left hander Matt Moore came into this season with the greatest of expectations. After a storybook end to
Moore’s fastball is probably the best in the game. His 94.2 mph offering ranks as the 5th quickest among starters, but it’s the movement that sets his it apart. His heater has 9.1 inches of horizantal movement (bested only by Chris Sale), and 11.1 inches of vertical movement (good for 5th). We know his fastball tails all over the place and is super fast, but this does little to explain the inflated ERA.
Recently, Dave Cameron of fangraphs wrote that Matt Moore needed a better breaking ball. Mr. Cameron stated that all lefties hitting like Josh Hamilton off of Moore was due largely to the neutralization of his devastating changeup against the same-handed batters. Cameron’s argument continued that lefties were left to guess between fastball and slider. With the slider being the weaker of the two offerings, left handed hitters were able to sit on his very good fastball. Since then, Moore’s lefty opponents have hit more like Andre Ethier. I just don’t see how his slider (a pitch he throws just 13.7% of the time) is the real issue.
I’m more stuck on why that great fastball, with that great movement hasn’t allowed Moore to simply pound the zone and get outs quickly.
I found my answer in Moore’s heat map. Notice how Moore is leaving his fastball right down the middle, even a bit out, where right handed hitters can get their hands extended and catch up to the 95 mph heat.
Moore has struck out hitters at a rate of 8.86/9 IP. To compare, Mr. Verlander checks in at 8.87 K/9. The problem isn’t in Moore’s stuff. It isn’t in his changeup or slider. It’s his location. And he’s missing in the wrong direction: over the middle. In 2010 Jonathan Sanchez found success (3.07 ERA) while walking about the same rate of hitters. In 2008 Daisuke Matsuzaka (2.90 ERA) and 2009 Clayton Kershaw (2.79 ERA) each had higher walk rates than Moore does today. Moore can be successful if he tries to live on the black and misses away. Right now those 9.1 inches are tailing right over the middle.
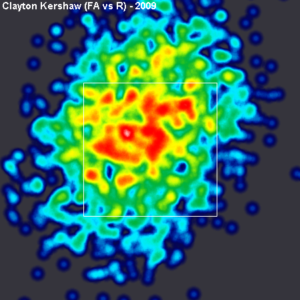
That all said, it’s not like Moore’s been all bad. His gifted left shoulder is still intact and I’m sure most fans would be happy to have so much promise in a kid as young as Matt Moore. Many young pitchers go through these stretches where location is difficult, just ask Jeff Samardzija. Kershaw’s 2009 campaign is also a great example. Moore simply has to keep plugging along and Cy Young’s will be on his mantel, just as they are for Mr. Kershaw. Just for fun here’s Kershaw’s heat map from that 2009 season. Notice how everything is right down the middle.
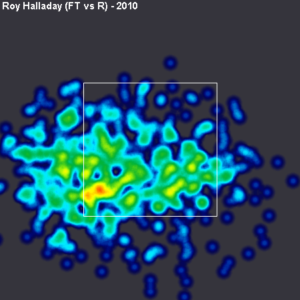
Young Matt Moore just needs to learn to move that red blob down and away. Like Roy Halladay:
Stat of the Day: In 2010, from whence that Heat Map comes, Roy Halladay won the Cy Young while leading the NL in 8 different categories, including wins, shutouts, strikeouts, and innings pitched.
-Sean Morash
Add The Sports Daily to your Google News Feed!


