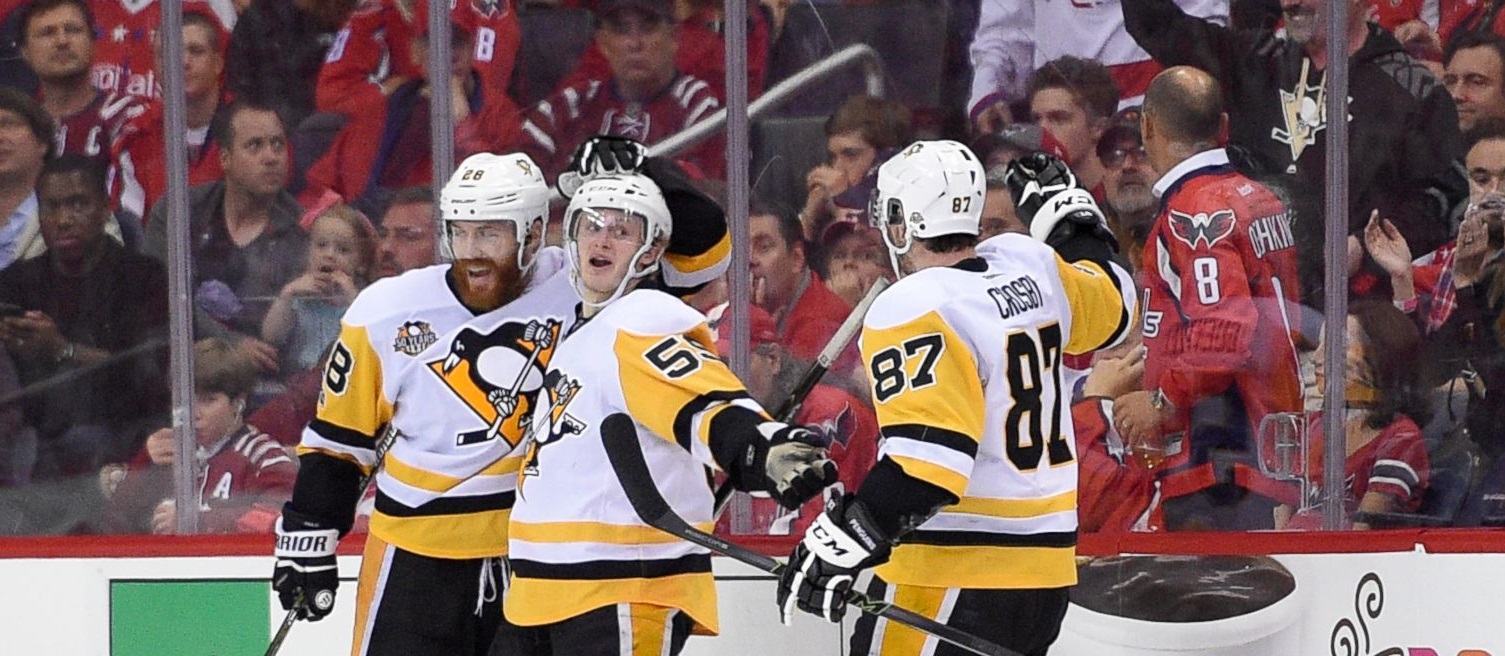
Nearly 36 hours after the Penguins defeated the Capitals 6-2 on Saturday night to take a 2-0 Second Round series lead before any games have even been played in Pittsburgh, there are thousands of fans on both sides still wondering how this is even possible. Visually, it doesn’t make any sense. If one muted the TV and covered up the on-screen scoreboard and watched the majority of action (excluding actual goals scored) from the middle of the second period of Game 1 until the end of Game 2, 100 out of 100 people would reasonably guess that the Capitals, dominant in puck possession and shot attempts, earned wins in both games.
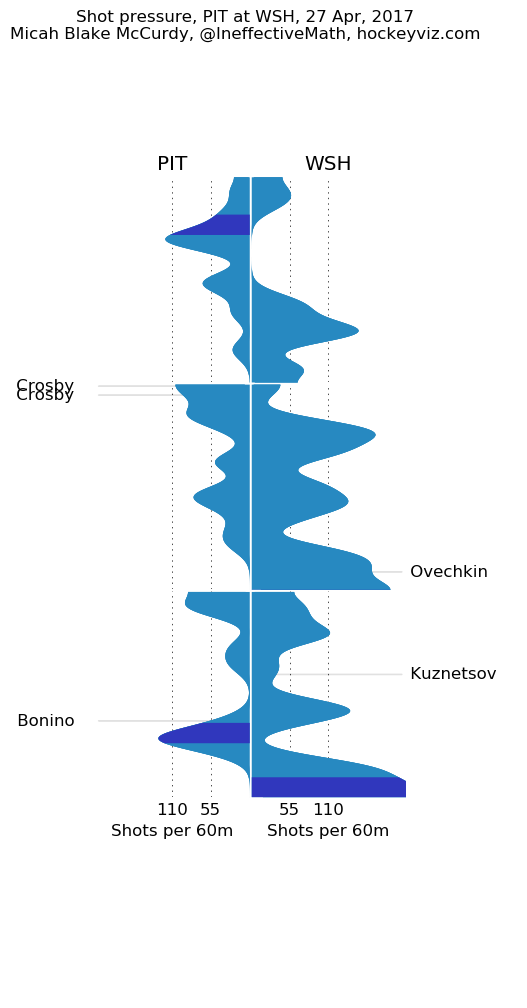
From HockeyViz – click for shot pressure diagram descriptions
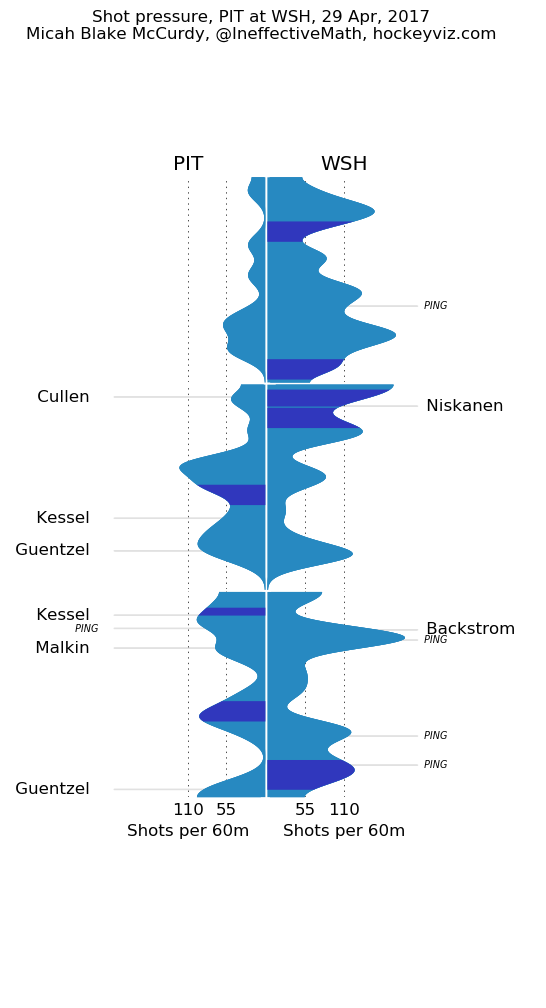
Yet angst hangs over D.C. again this spring as the Penguins again lead a playoff series over the supposedly vaunted, loaded Capitals. Many will point to luck – good for the Pens, terrible for the Caps (note the four posts they hit in the Game 2 shot pressure diagram) – properly concluding that what occurs in a miniscule sample size of two games may deviate heavily from trends observed in the regular season 82-game schedule.
Indeed, speaking of luck, the Grim Reaper of Regression has stabbed his sickle into Washington’s groin.
All data in charts below obtained from Corsica.
[office src=”https://onedrive.live.com/embed?cid=2A728A26A493C6FE&resid=2A728A26A493C6FE%21152&authkey=AKboCQpcg5Bg7Ks&em=2&wdAllowInteractivity=False&wdHideHeaders=True&wdDownloadButton=True” width=”525″ height=”463″]The back-to-back Presidents’ Trophy champions led the NHL in 5v5 PDO (shooting % + save %) but have fallen well below 100 in Games 1 and 2 combined against Pittsburgh, to rank last among the eight remaining teams in the Stanley Cup playoffs. Meanwhile, the Pens’ PDO is clicking at a ridiculous, unsustainable 112.4, tops among Second Round clubs.
But beyond simply luck, what else is contributing to Pittsburgh’s improbable 2-0 series lead? How can the Capitals, taking more than 2 out of 3 shot attempts thus far for an unreal 68.12 CF%, have no wins despite this advantage?
I thought the answer might lie in an area that Pittsburgh head coach Mike Sullivan emphasizes more than simply shots directed at the net. Since Corsi (blocked, missed or actual shots on goal) has passed from “fancy/advanced” stats into standard usage, teams are always on the lookout for the next undervalued or misinterpreted concept. Sullivan often states that he and his staff go beyond shot attempts or shot differentials and focus on scoring chances, as noted in the linked article by Bill West. Intuitively, this makes sense: while Corsi is blind to shot location, shot quality and shot type, scoring chances – depending on how detailed one defines the term – can take all those shot characteristics into account.
(Bill West joined the Pensblog’s Rich and Jesse on the Miller vs. Marshall Podcast back in mid-February.)
Referring to the above charts, Sullivan’s squad led the NHL in regular season scoring chances per 60 minutes, finishing fifth league-wide in scoring chances percentage. Yet neither the Capitals or Penguins possess a distinct advantage through two games of their current series: Washington’s overwhelming shot advantage has not translated into a scoring chance advantage and while the percentages on the chart make it seem like the Penguins have the clear lead, Pittsburgh’s scoring chance lead at 5v5 play (not shown in the chart) is only 7-6.
What about the most glaringly obvious factor: how wide is the gulf between the two goaltenders’ performance?
Larger than the Persian Gulf. Large enough in the precise details to explain the Penguins coming home with a 2-0 lead.
[office src=”https://onedrive.live.com/embed?cid=2A728A26A493C6FE&resid=2A728A26A493C6FE%21153&authkey=AL3jzLa-bo93dtw&em=2&wdAllowInteractivity=False&ActiveCell=’Sheet1′!A1&wdHideHeaders=True&wdDownloadButton=True” width=”450″ height=”415″]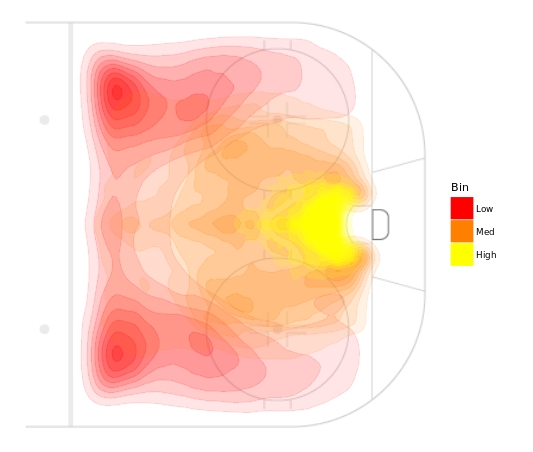
Danger zones diagram from Corsica
While Braden Holtby led Marc-Andre Fleury during the regular season in save percentage from all three danger zones, Holtby’s inability to adequately stop medium-danger shots by the Penguins in Games 1 and 2, is the overwhelming reason why Washington finds itself in this predicament. Consequently, Holtby is giving up over two goals per 60 minutes at even-strength more than expected, while Fleury is outperforming expectations by better than a full goal in the same situations.
 It is reasonable to expect Holtby to rebound upwards and deliver one or more strong games in this series, Likewise, Fleury’s performance and the Pens’ rate of scoring both should revert downwards especially with the potential loss of Patric Hornqvist. Yet in a short four to seven game sprint, who’s to say it will happen tonight or Wednesday night? With Carl Hagelin and his speed back in the lineup, the Penguins ability to rapidly move the puck up ice received another boost Saturday, making it even harder for the Capitals to defend and limit scoring chances.
As the Washington Post lamented, “the Penguins are ruthlessly efficient”. They have economically cashed in on breakaways and odd-man rushes already. (For great video analysis of how the Penguins are generating odd-man rushes, read Jesse’s post today.) Continuing to “just play” the same way will likely lead to yet another triumph over the Capitals.
Add The Sports Daily to your Google News Feed!