June’s Five Worst Starting Pitchers
It seems like pitchers are always evaluated by the same traditional metrics, such as win-loss record, ERA, WHIP, strikeouts per nine innings and walks allowed per nine innings. This is exactly why we’re going against the grain and evaluating pitcher performance by SIERA.
SIERA attempts to measure the underlying skill of a hurler, but unlike FIP and xFIP, it doesn’t ignore balls put in play, and also attempts to give a more accurate picture as to why certain pitchers are better than others. A good SIERA is just like a good ERA — the lower the better.
Here are the five hurlers who struggled the most in June.
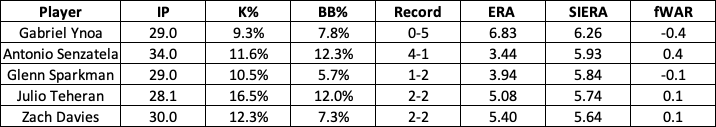
It’s tough being on the Baltimore Orioles these days. Gabriel Ynoa hasn’t had a lot of fun with the big-league club in 2019, and five of his six total losses have come in the past month. He’s allowed 2.13 home runs per nine innings, which is a common theme among Oriole pitchers with at least 50 frames. He’s one of three with that number above 2.00 (Dylan Bundy at 2.03 and David Hess at 2.86).
On the surface, Antonio Senzatela had a great month — his fWAR is more than the other four pitchers combined, along with accumulating the most wins and lowest ERA. He’s done it with a higher walk rate than strikeout rate, which is typically not a recipe for success. He did make some positive strides in his batted-ball profile, as his hard-hit rate allowed (31.4%) is down 10 percentage points from the month prior. Senzatela also saw his ground-ball rate amp back up to 54.3% (47.1% in May).
Meanwhile, Glenn Sparkman has watched his hard-hit rate allowed get worse (37.6% to 40.8%). That’s been paired with allowing fewer ground balls (47.0% to 38.4%) and more contact overall (79.6% to 85.9%). His 4.07 ERA is lower than what it was last year, but he’s also been worth -0.1 fWAR through 55.1 total innings (0.3 fWAR in 38.1 innings last year).
Julio Teheran‘s overall stats don’t look terrible (3.99 ERA, 0.7 fWAR), but he’s having a hard time finding any level of consistency. After posting a 5.35 ERA in March/April, he bounced back in a big way in May with a 0.98 mark before struggling again this past month. He’s had issues with his slider — after posting a 35.9% strikeout rate and 47 wRC+ with it in 2018, those numbers have decreased to 27.6% and 103, respectively, in 2019.
Zach Davies‘ monthly progression also isn’t going in a favorable direction. After posting a 1.38 ERA in March/April, that number increased to 3.10 in May before the above 5.40 mark in June. His homers allowed per nine innings rate has also gone from 0.55 to 1.24 to 1.50 over the season’s first three months of play.
Add The Sports Daily to your Google News Feed!