
The answer to the above question should come as no surprise to anyone paying even the slightest bit of attention to the Pittsburgh Penguins this season.
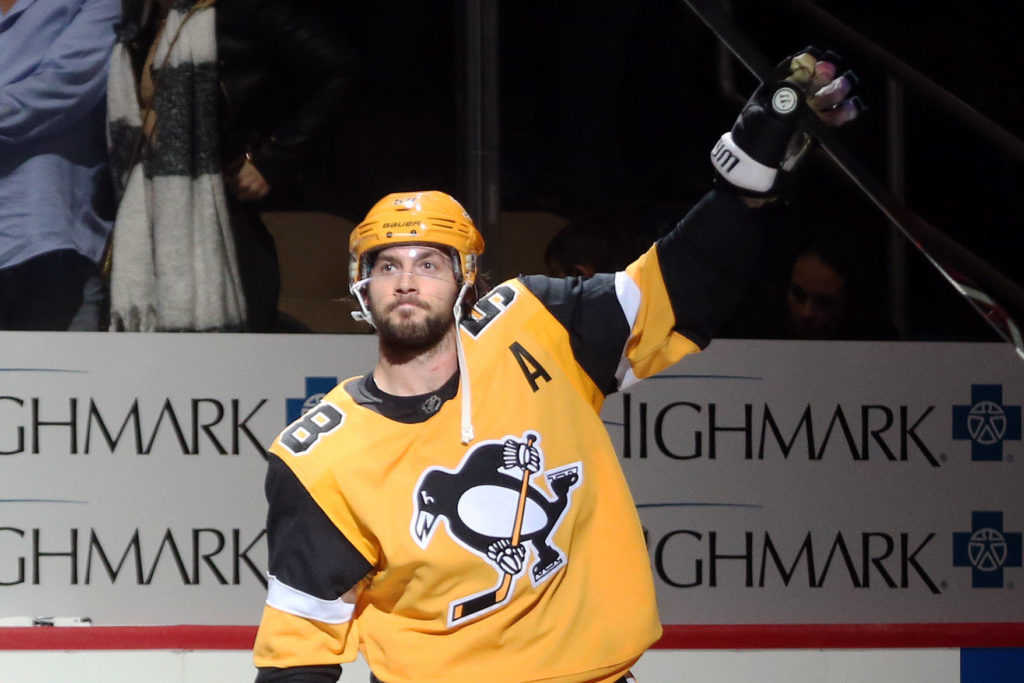
Kris Letang has been, in a word, incredible.
Much of this, from a high level, can be seen through Bill Comeau’s SKATR tool:
Kris Letang ladies and gentlemen.
Don't get too caught up in PP point producers when you consider the Norris.
5-on-5 is where elite defensemen need to make a difference.#Penguins #Pens #LetsGoPens pic.twitter.com/PnRhNdnEtR— Bill Comeau 🇨🇦🇺🇦 (@Billius27) January 21, 2019
Seeing all of those 80s and 90s should not be taken lightly. It means that Kris Letang finds himself among the best of the best in the NHL.
Some have called it a redemption tour. Others have called it a bounce back campaign. Still, others, will have seen this sort of season coming from the Penguins #1 defenseman.
And coming off what was considered his “worst” in a Penguin uniform, you could justify the bounce back and redemption tour qualifiers. To the naked eye, he had his struggles last year, despite putting up underlying numbers on pace with or better than last season’s Norris finalists to go along with his 51 points.
But just how good has Kris Letang been this season?
It didn’t take long for Letang to start setting the world ablaze this season with his eye-popping play and the following two exchanges from October’s win over Vegas could not have been any more emblematic of that. The skating, the confidence, the strength and power all on display at critical points of the game.
Seriously. Letang is a freak. He goes from being totally flat-footed to closing Haula down and sending him out of the zone and out of the frame in next to no time. Animal. pic.twitter.com/86msI9o4RI
— nerd king geoff (@geoffwithano) October 12, 2018
But even beyond the plays like these that he makes on a regular, consistent basis, Letang’s underlying numbers at 5v5 really paint a larger picture of how good he’s been.
Note: All data herein via Natural Stat Trick unless otherwise noted.
On Ice
First, let’s take a look at his raw shot attempts and how they compare to last season as well as where he ranks among the 206 defensemen that have played a minimum of 300 minutes of 5-on-5 ice time this season. This comparison will be carried out throughout the rest of this post.
| Category | 2017-18 | 2018-19 | 2018-19 Rank |
| Shot Attempts For (per hour) | 63.66 | 65.27 | 17th |
| Shot Attempts Against (per hour) | 51.94 | 55.65 | 85th |
| Shot Attempt Share | 55.07 | 53.97 | 27th |
| Relative Shot Attempt Share | 4.41 | 7.96 | 1st |
What should stick out first is that Kris Letang is ranked 1st in the NHL among those 206 defensemen that have played 300+ minutes at 5v5 in the share of on ice shot attempts relative to his teammates. That list includes Erik Karlsson (3rd), Mark Giordano (14th), John Carlson (18th), PK Subban (38th), and Brent Burns (41st). What this means is that, when Kris Letang is on the ice, the Penguins are generating nearly a +8 share of shot attempts more than when he’s off the ice. It’s worth noting, unsurprisingly, that Brian Dumoulin sits 2nd in the NHL in that category as he and Letang are virtually inseparable.
What’s also interesting is that Letang is on the ice for more shot attempts for compared to last season, but per 60 minutes of ice time, he’s been on the ice for just under 4 more shot attempts against. As such, he’s seen a drop in his overall share of shot attempts this season compared to that of last season, but still finds himself in around the 89th percentile among all defensemen (as seen in Bill Comeau’s viz above).
When looking closely at scoring chances, things get a little more interesting.
| Category | 2017-18 | 2018-19 | 2018-19 Rank |
| Scoring Chances For (per hour) | 31.89 | 30.92 | 17th |
| Scoring Chances Against (per hour) | 25.82 | 24.87 | 58th |
| Scoring Chances Share | 55.26 | 55.42 | 25th |
| Relative Scoring Chance Share | 5.38 | 7.23 | 7th |
| High Danger Scoring Chances For (per hour) | 13.26 | 13.58 | 11th |
| High Danger Scoring Chances Against (per hour) | 11.06 | 11.9 | 152nd |
| High Danger Scoring Chance Share | 54.53 | 53.30 | 54th |
| Relative High Danger Scoring Chances Share | 5.51 | 2.82 | 58th |
In the context of scoring chances, Letang is seeing almost identical numbers to that of his “bad” season last year. Per 60 minutes of ice time, he’s been on the ice for about 1 fewer scoring chance for, but also one fewer scoring chance against, which is leveling out his overall share of scoring chances. But, compared to last season, the Penguins are +2 in terms of their share of scoring chances while Letang is on the ice this season.
But when we look into high danger scoring chances, Letang still finds himself ranked 11th in terms of high danger scoring chances generated per 60 minutes of 5v5 ice time. Of course, that’s good. He’s seen one nearly one more high danger chance against per hour, though, which was a bit surprising. To put it into context, Jack Johnson’s 12.25 high danger scoring chances against is 163 out of those 206 defensemen. The difference, of course, is that Letang is generating more HD scoring chances than Johnson is. To expand on that context though, the company that Letang is keeping down in the depths of HD scoring chances against include Dougie Hamilton (11.82 – 151st), Brent Burns (12.07 – 156th), Morgan Reilly (12.62 – 179th), Oliver Ekman-Larsson (12.85 – 185th), and John Carlson (14.3 – 203rd).
And, relative to the rest of the Penguins, Letang’s +2.82 HD scoring chance share finds him ranked 2nd among the Penguins defensemen, just behind Brian Dumoulin, leaving them as only two of three Penguins with positive results in that category (with Pettersson being the other). That just screams out that Letang and Dumo are head and shoulders above the rest of the Penguins D-men.
It should be noted, too, that of the 7 Penguins defensemen that have played 300 minutes this season, only Riikola (48.68%) and Johnson (47.86%) have found themselves on the wrong side of the 50% threshold in terms of on-ice high danger scoring chance share. So, as a whole, the Penguins give up a lot of high danger chances, but they also generate more than they give up (487 for, 453 against this season).
Obviously, the end result of all of this is important and goals are, without question, the end result. Here’s what they look like this season:
| Category | 2017-18 | 2018-19 | 2018-19 Rank |
| Goals For (per hour) | 2.29 | 3.63 | 7th |
| Goals Against (per hour) | 3.2 | 2.15 | 55th |
| Goals For Share | 41.67 | 62.79 | 8th |
| Relative Goals For Share | -11.98 | 13.21 | 15th |
| Expected Goals For* | 2.89 | 2.99 | 11th |
| Expected Goals Against* | 2.33 | 2.5 | 135th |
| Expected Goals For Share* | 55.39 | 54.48 | 35th |
| Shooting Percentage (on ice) | 6.55 | 9.85 | 37th |
| Save Percentage (on ice) | 88.76 | 92.69 | 69th |
Note: Expected Goals comes via Corsica.Hockey.
First, let’s take a look at the expected goal-based numbers here. Remember: expected goals factors in shot type, location, angle, rebounds, rush shots, and game state.
It should come as no surprise, after seeing what Letang’s on-ice high danger scoring chance against numbers look like, that he finds himself in the bottom half of the 206 defenders in expected goals against. It’s worth noting, though, that the following big name defensemen also find themselves around Letang or worse off in terms of expected goals against per hour: PK Subban and Roman Josi (2.46 – joint 127th), Marc-Edouard Vlasic (2.53 – 143rd), Dougie Hamilton (2.54 – 144th), Seth Jones (2.6 – 163rd), John Carlson (2.81 – 190th), and Morgan Rielly (2.93 – 198th).
And, again, because Letang is out-pacing his expected goals against with the 11th best expected goals for, there’s hardly reason for concern. You want Kris Letang to be in the upper echelon of the “for” categories maybe more so than anything else.
Now, because we care about pucks going in the net, let’s look at the actual goal-based data buckets above. In all 6 categories, Letang has seen a positive movement in each. His on-ice goals for per hour is up, his on-ice goals against per hour is down, his overall goals for share and relative share are both up. Regression, for all intents and purposes, has taken the wheel.
Consider this: Since 2007-08, Letang’s on-ice shooting percentage has typically hovered right around the 7.5-8% range. Last season’s 6.55% was the second worst run of bad shooting luck he’s seen on-ice in his career, only outdone by a horrific 5.81% in 2013-14. As if that’s not enough, last season’s 88.76% on-ice save percentage was far and away the worst he’s ever experienced. Traditionally, Letang’s on-ice SV% year in and year out has been a hair under 92%. This is a luck-based sport and perhaps nothing shows that more than this.
In my post back in June, I had these two things to say about Letang’s poor run of luck:
If [Letang] is backed up by slightly better goaltending, particularly in October and November when it was at its absolute worst, the story of his season may have a different narrative surrounding it.
…
Again, a bounce back year in 2018-19 from one of the best young netminders on Earth and returning to form changes the story completely surrounding [Letang].
And, to this day, it holds true. Letang’s story in 2018-19 is drastically different than that of 2017-18, even if the majority of his underlying on-ice stats fall in line with his “sub-par” season last year. The reason is partially because of things beyond his control: the puck is going in the net for his team more and staying out of his own goal more this year than it did last year.
Everything else across the board has remained the same while Letang is on the ice.
But how does that compare to his individual stats?
Individual
Before we wrap this up, we want to examine how he’s doing on an individual level because this, too, helps paint the picture as to why he looks and feels much better this year than last year at a 5-on-5 basis.
So, with all of that in mind, what has the end result been for Letang on an individual basis?
| Category | 2017-18 | 2018-19 | 2018-19 Rank |
| Goals | 4 | 7 | 2nd |
| Goals (per hour) | 0.17 | 0.47 | 8th |
| Assists | 13 | 15 | 11th |
| Assists (per hour) | 0.54 | 1.01 | 25th |
| First Assists | 3 | 8 | 9th |
| First Assists (per hour) | 0.12 | 0.54 | 18th |
| Total Points | 17 | 22 | 9th |
| Total Points (per hour) | 0.71 | 1.48 | 13th |
Given that we just saw above that Letang’s on-ice shooting percentage has increased nearly 3 full percentage points, it stands to reason that his individual production should also be increasing compared to that of last season. That’s exactly what we see here. In fact, at 5v5, Letang has already exceeded his output from last season and is just 11 points shy of his 51 point production last season at all strengths. His 40 points through 46 games this season (0.87 points per game) has him on pace for a career best 69 points in 80 games (he missed two earlier this season).
This, too, is a big reason why Kris Letang is in Norris conversations and, again, it comes down to regressing back towards his mean and, in some cases, even exceeding that average.
As it stands right now, Letang’s 0.47 goals per hour of ice time would be the best of his career, ahead of the 0.36 from 2015-16, seen as probably the best season Letang has ever had (16G-51A-67P in 71 games). The same can be said about his 1.01 assists per hour, which would be his 3rd best output (1.35 in 11-12, 1.74 in 2013), and primary assists per hour (0.74 in 11-12, 0.97 in 2013). His current rate of 1.48 points per 60 minutes would also be his 3rd best season behind the 1.55 in 11-12 and an astronomical 2.03 in the lockout-shortened 2013 season.
But, as we saw with the on-ice stats, is Letang really doing anything differently this season than last?
| Category | 2017-18 | 2018-19 | 2018-19 Rank |
| Shots On Goal (per hour) | 7.07 | 7.26 | 7th |
| Shooting Percentage | 2.35 | 6.48 | 37th |
| Shot Attempts (per hour) | 13.97 | 12.84 | 28th |
| Scoring Chances (per hour) | 2.91 | 2.82 | 39th |
| High Danger Scoring Chances For (per hour) | 0.5 | 0.4 | 83rd |
| Rush Attempts (per hour) | 0.12 | 0.2 | 67th |
| Rebounds Created (per hour) | 0.83 | 0.6 | 74th |
| Giveaways (per hour) | 2.45 | 2.29 | 85th most |
| Takeaways (per hour) | 1.66 | 2.42 | 8th |
| Total Expected Goals (xGF per hour) | 6.56 (0.27) | 3.96 (0.27) | 10th (14th) |
The answer is a firm “not really.”
To illustrate that, look no further than his individual expected goals. Letang’s expected goals per hour this season is actually exactly the same as last season and, with respect to this season, is 10th best per 60 minutes of ice time among the 206 defenseman that have played 300+ 5v5 minutes. That, too, is astonishing.
It’s worth pausing for a moment here to appreciate Kris Letang as a defender. One of the biggest knocks against him has always been his “giveaways,” but this season 84 other defensemen have turned the puck over more than him, including Brent Burns (3.37 – 14th most), Erik Karlsson (3.11 – 22nd most), Drew Doughty (3.01 – 29th most), John Klingberg (2.98 – 31st most), Dougie Hamilton (2.78 – 42nd most), and PK Subban (2.46 – 67th most). What’s more, only Jaccob Slavin, Calvin de Haan, Erik Karlsson, Shea Theodore, Brent Burns, Morgan Rielly, and TJ Brodie have been credited with more takeaways per hour of ice time than Kris Letang. That’s just remarkable.
But, what sticks out more so than anything else above is Kris Letang’s individual shooting percentage. Season-by-season, the Penguins’ #1 defenseman has seen various shooting percentages at 5v5, ranging anywhere from 1.69% n 09-10 to 6.48% this season. Over his entire career, his shooting percentage is right around 4.11%. Keeping the theme of last season versus this season, we can reasonably say that his below average 2.35% last year can be chalked up to bad shooting luck, while his 6.48% can be chalked up to good shooting luck.
To that end, Letang is hitting the net marginally more with his shot attempts this year despite attempting just over 1 fewer shot per hour, while actually generating fewer scoring chances, high danger scoring chances, and rebounds than he did last season (albeit by a marginal amount). The puck just happens to be going in far more frequently for him this year than last, just as it has for the team when he’s on the ice.
To visually represent much of this, let’s go back to Bill Comeau’s SKATR viz to compare 2018-19 Letang (left) with 2017-18 Letang (right).
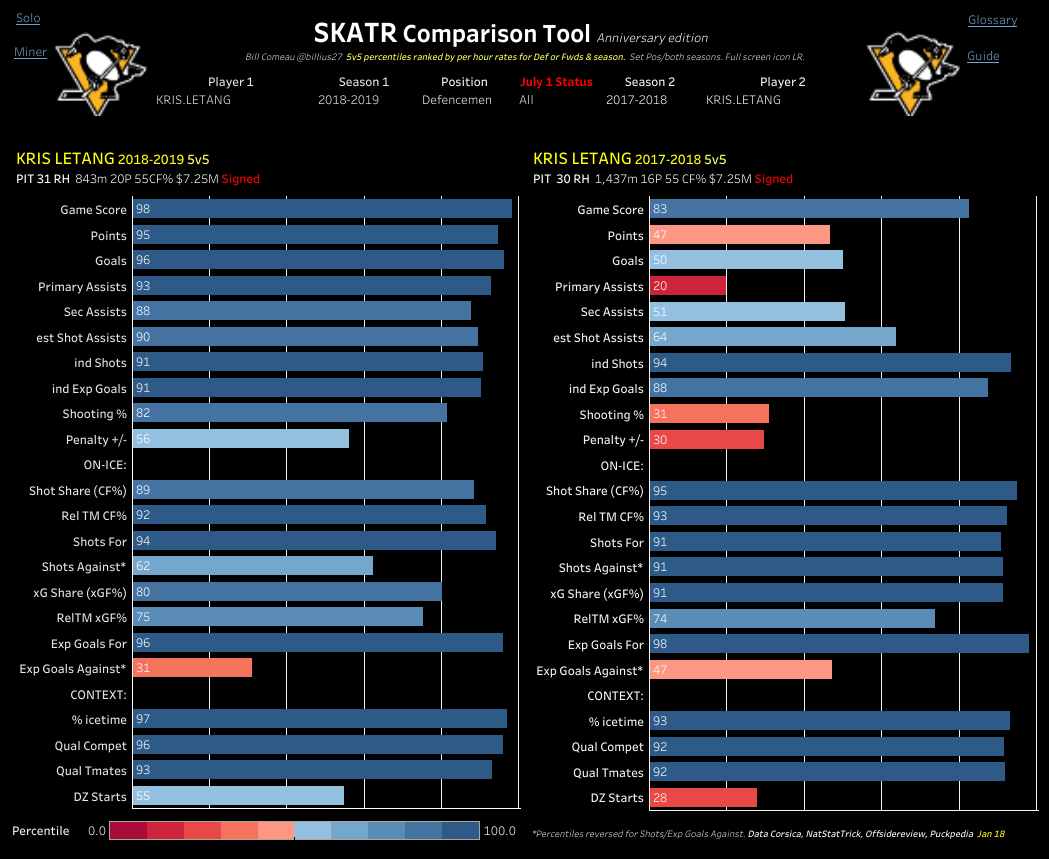
What should stand out at this point is that the biggest increase from last year to this year falls solely his individual point-based categories and the not-show goals for share. By and large, the rest remained the same.
So where does that leave us?
Well, to refresh from June again:
The fact remains that with a little bit of different luck (and a little bit of regression), you should hear a different narrative surrounding [Letang’s] season storyline in a year’s time if he does a lot of the same things next year that he did this year.
The 2018-19 version of Letang has gotten everything he needed in that regard. He’s gotten healthy, he’s gotten a little bit of different luck, and he’s gotten a little bit of regression. The narrative surrounding him this season has been vastly different than that of last season, despite adhering to much of the same processes he did last season.
The end product of him being 6th in scoring among all defensemen, pucks going in the net for his team and pucks staying out of his own net have been the key differences and, as a result, should find him firmly planted in the Norris conversation come late spring.
Add The Sports Daily to your Google News Feed!